Identification of Intact Monoclonal Antibody with LC-HRMS
Ricardo Cunha
cunha@iuta.de29 September, 2025
Source:vignettes/articles/demo_lc_hrms_identification_antibody.Rmd
demo_lc_hrms_identification_antibody.RmdIntroduction
This document demonstrates the identification of the intact monoclonal antibody Bevacizumab using LC-HRMS data. The files consist of a triplicate QC and a triplicate sample to be identified.
basename(files)[1] "20240815_67_BVCZ_1.d" "20240815_67_BVCZ_2.d"
[3] "20240815_67_BVCZ_3.d" "QC_BVCZ_1608_2_5mgmL_1.d"
[5] "QC_BVCZ_1608_2_5mgmL_2.d" "QC_BVCZ_1608_2_5mgmL_3.d"Processing Engine
The StreamFind package provides a flexible and powerful
framework for processing mass spectrometry data. In this example, we
will use the MassSpecEngine class to handle the LC-HRMS
data. The engine will be initialized with the raw files, and we will
specify that the data should be centroided and processed at level 1.
Note that The msconvert from ProteoWizard was used in
the background to convert the files to the open format mzML.
# Starts engine for identification
ms <- StreamFind::MassSpecEngine$new(
  metadata = list(name = "Identification of Bevacizumab"),
  analyses = files,
  centroid = TRUE,
  levels = 1
)

# Assign analysis replicate groups
ms$Analyses <- set_replicate_names(
  ms$Analyses,
  c(rep("Sample", 3), rep("QC_2.5", 3))
)

DT::datatable(
  info(ms$Analyses)
)
Workflow
# Load Total Ion Chromatograms (TIC) for detecting the API
ms$run(MassSpecMethod_LoadChromatograms_native(chromatograms = "TIC"))

# Smooth TIC chromatograms
ms$run(MassSpecMethod_SmoothChromatograms_movingaverage(windowSize = 5))
plot_chromatograms(
  ms$Results$MassSpecResults_Chromatograms,
  colorBy = "replicates"
)
# Find peaks in the TIC chromatograms
ms$run(
  MassSpecMethod_FindChromPeaks_LocalMaxima(
    minWidth = 5,
    maxWidth = 10,
    minHeight = 10E6
  )
)
plot_chromatograms_peaks(
  ms$Results$MassSpecResults_Chromatograms,
  colorBy = "replicates+targets"
)
# Load spectra based on integrated chromatograms
ms$run(
  MassSpecMethod_LoadSpectra_chrompeaks(
    mzmin = 2500,
    mzmax = 3700,
    levels = 1,
    minIntensity = 1000
  )
)
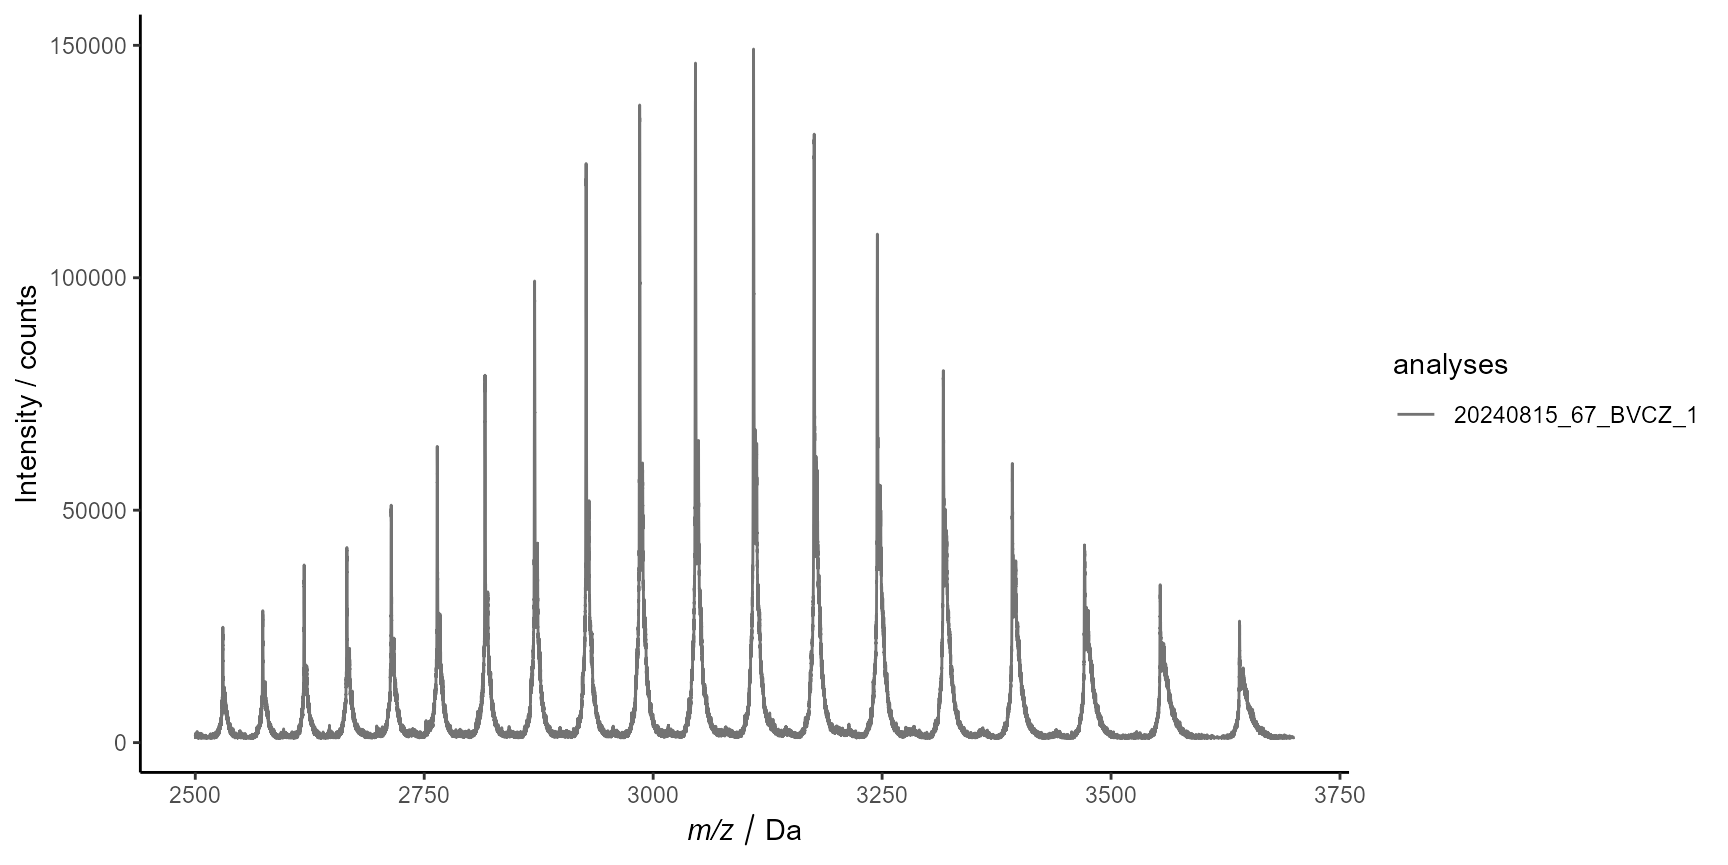
# plots only the spectra of the first analysis
plot_spectra(
  ms$Results$MassSpecResults_Spectra,
  analyses = 1,
  interactive = FALSE
)
# Calculate spectra charges for de-clustering and deconvolution
ms$run(
  MassSpecMethod_CalculateSpectraCharges_native(
    onlyTopScans = TRUE,
    topScans = 6,
    roundVal = 25,
    relLowCut = 0.2,
    absLowCut = 0,
    top = 10
  )
)
plot_spectra_charges(ms$Results$MassSpecResults_Spectra)
# Deconvolute spectra to obtain mass values
ms$run(
MassSpecMethod_DeconvoluteSpectra_native(
clustVal = 0.001,
window = 25
)
)
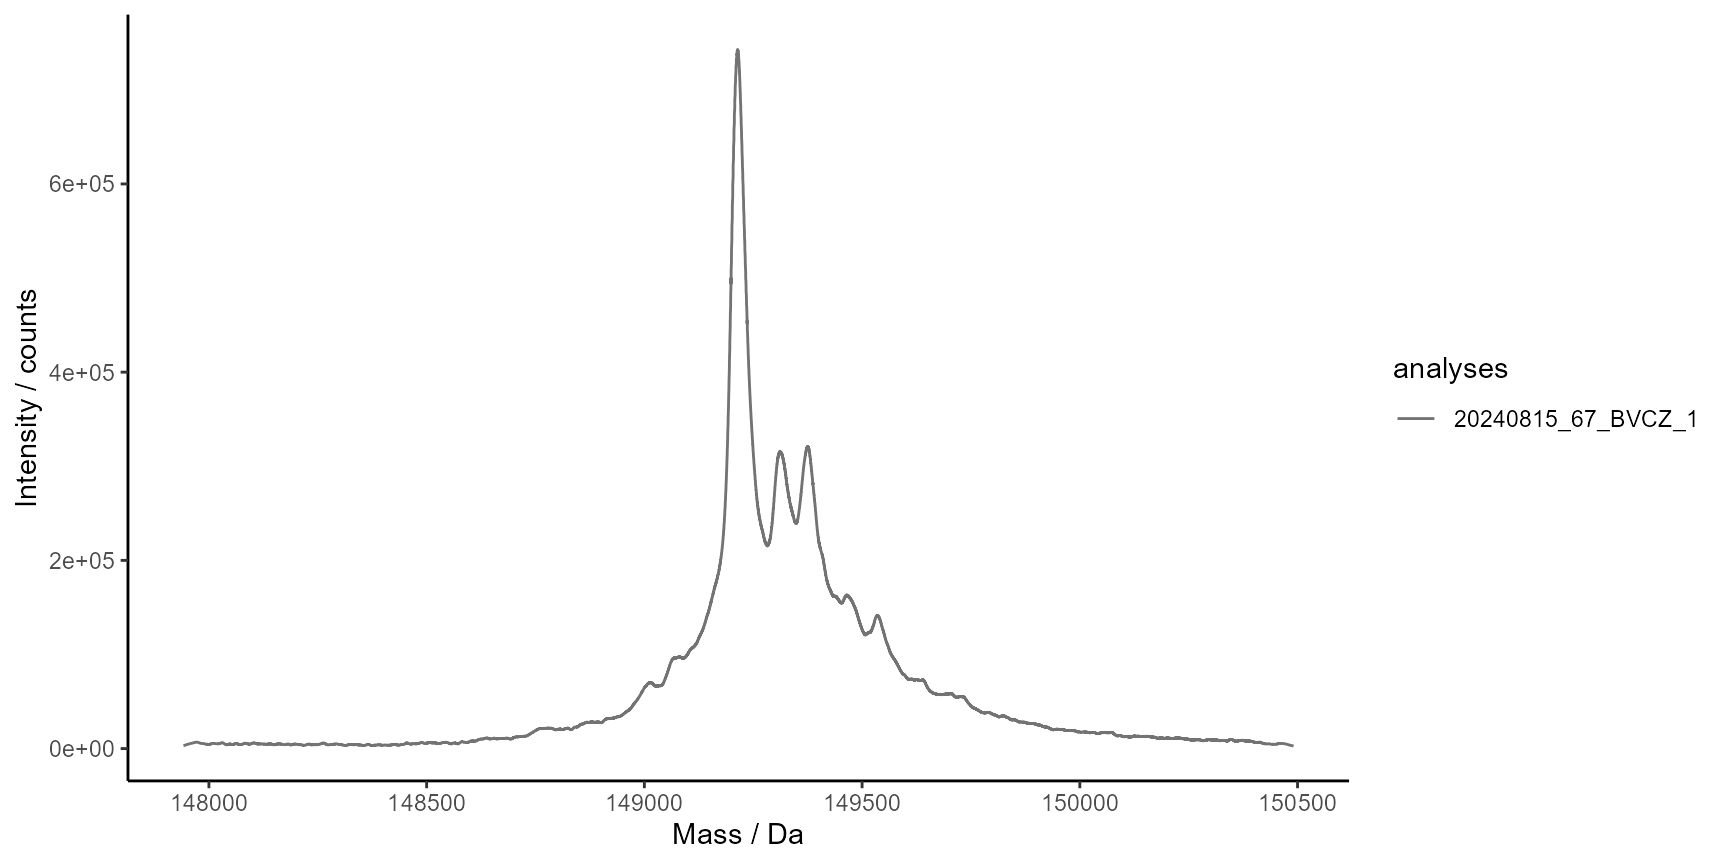
# Smooth deconvoluted spectra
ms$run(
MassSpecMethod_SmoothSpectra_savgol(
fl = 141,
forder = 4,
dorder = 0
)
)
plot_spectra(
  ms$Results$MassSpecResults_Spectra,
  analyses = 1,
  interactive = FALSE
)
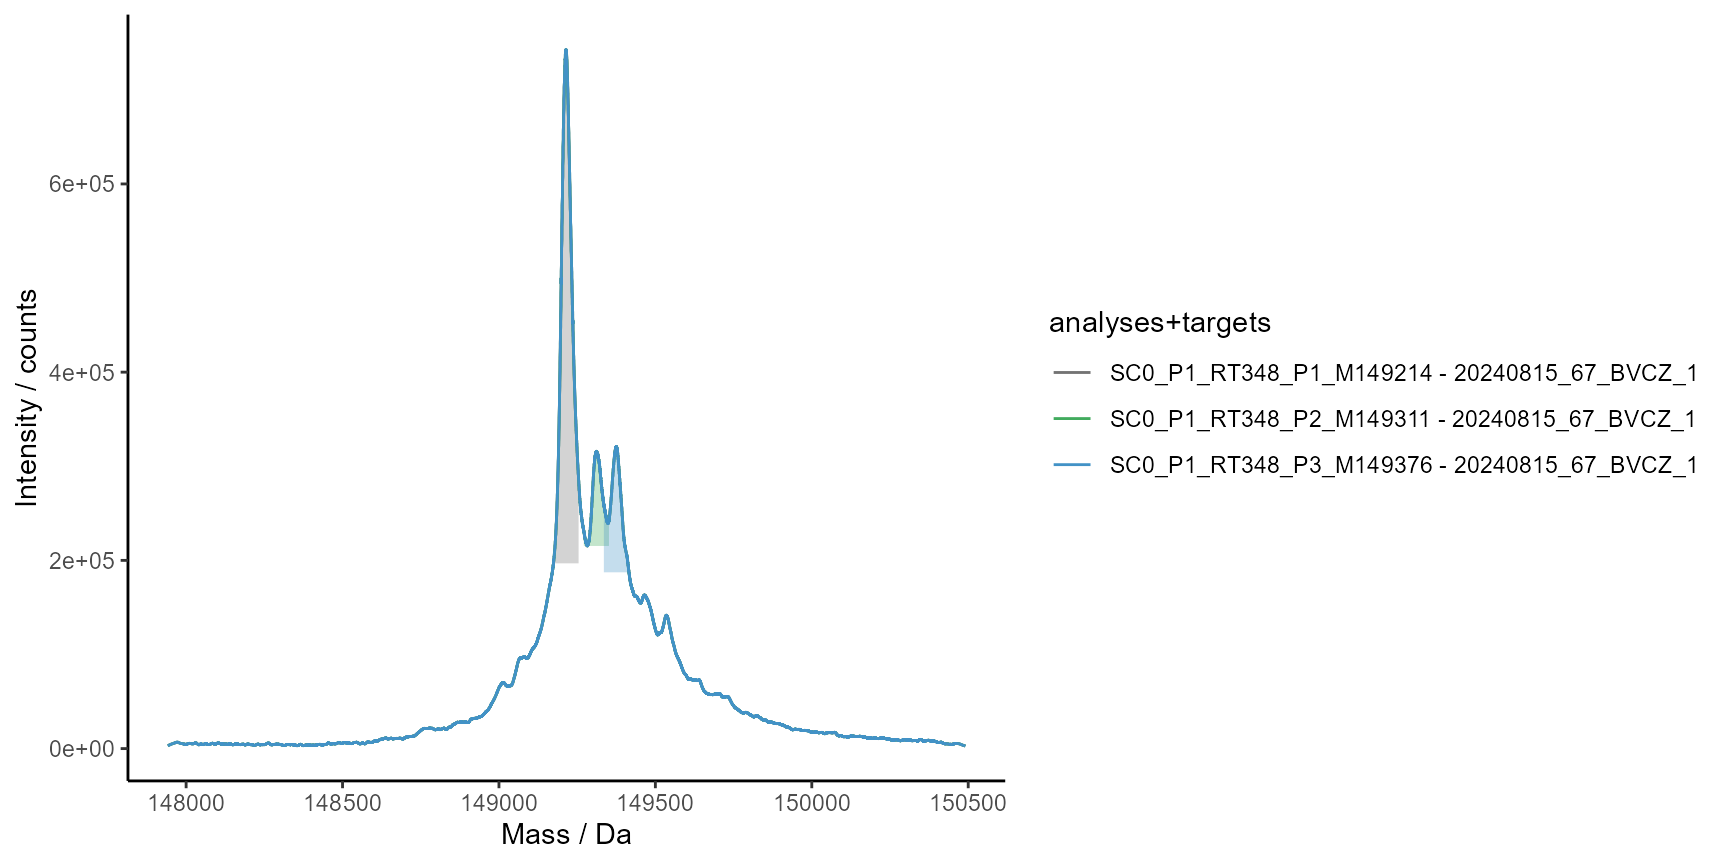
# Find spectra peaks to verify mass values and evaluate identity
ms$run(
  MassSpecMethod_FindSpectraMaxima_native(
    minWidth = 10,
    maxWidth = 60,
    minHeight = 50000
  )
)
# Plot spectra peaks for the first analysis
plot_spectra_peaks(
  ms$Results$MassSpecResults_Spectra,
  analyses = 1,
  colorBy = "analyses+targets",
  interactive = FALSE
)